
Capturing the period between 1830 and 1865, the following tables and maps visualize statistical information and trends connected to the 1843 national convention. Convention delegates sponsored and published reports measuring the condition of African American communities in various parts of the nation. One such report included in the minutes to the 1843 national Colored Convention reflect delegates’ interest in collecting and submitting statistics “upon the condition of colored people” in free states. Each chart visualizes aspects of the statistical report published in the minutes of the 1843 convention.
» Interact with tables by hovering over graph points and selecting values in right-hand columns. Click pins to interact with maps.
Figure 1: Delegate Attendance Trends at National Conventions, 1830-1864
This graph compares reported populations of colored people in Massachusetts, New York, and Ohio. Data is drawn from the statistical report published in the 1843 convention minutes. The term “colored” is taken from the statistical report.
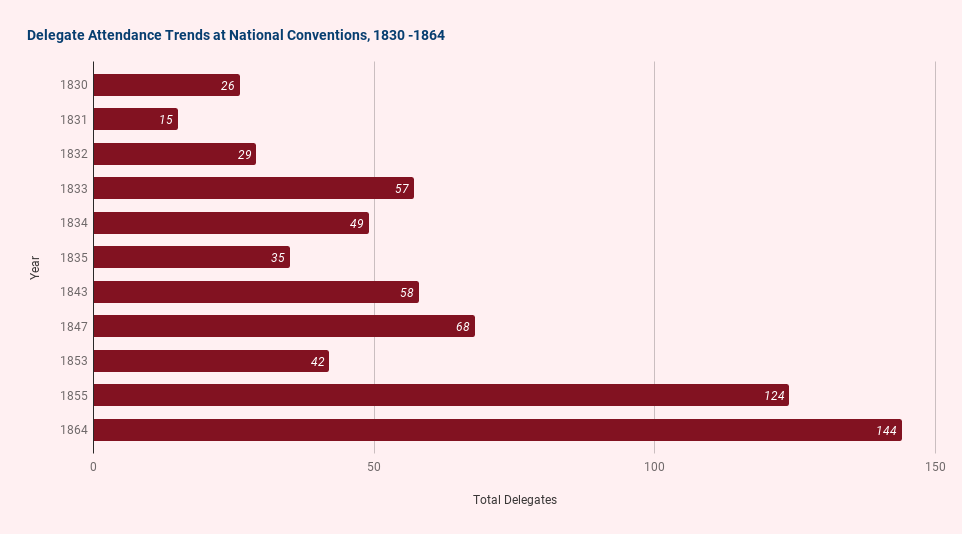
Figure 2: Dollar Amount of Wealth Per Person
This table describes the amount of real estate wealth per colored person in New York and Ohio cities. The value of real estate is adjusted for population in its visualization of geographically located wealth. Data is drawn from the statistical report published in the 1843 convention minutes.
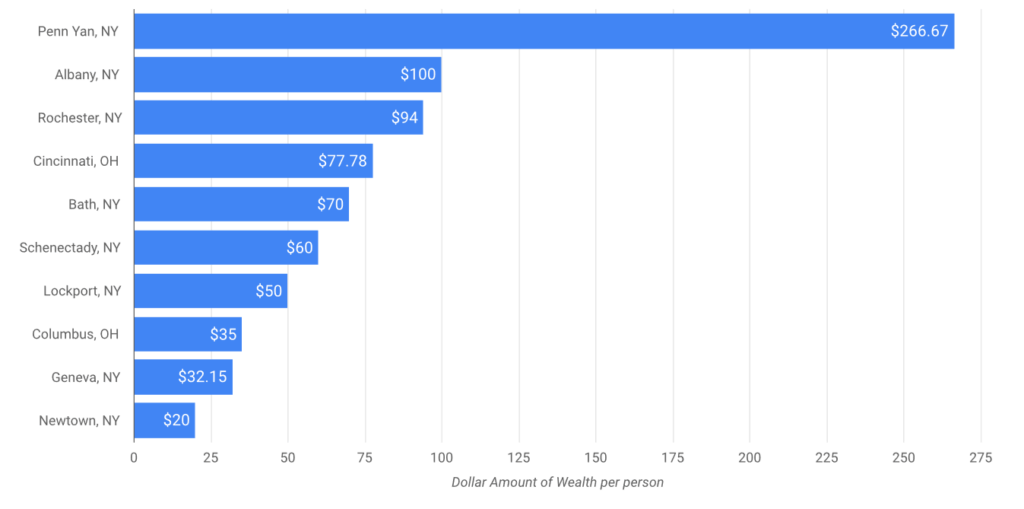
Figure 3: Reported Occupations in the Northeast and the West, 1843
This graph charts the number and variety of reported occupations in the northeast and the west. Cities without values reflect absent statistics in the printed report. Data is drawn from the statistical report published in the 1843 convention minutes.
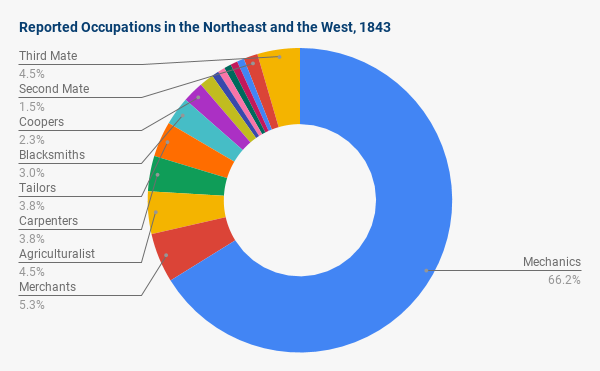
Figure 4: Reported Societies in New York, 1843
This graph represents the number and variety of reported societies in cities in New York. Cities without values reflect absent statistics in the printed report. Data is drawn from the statistical report published in the 1843 convention minutes.
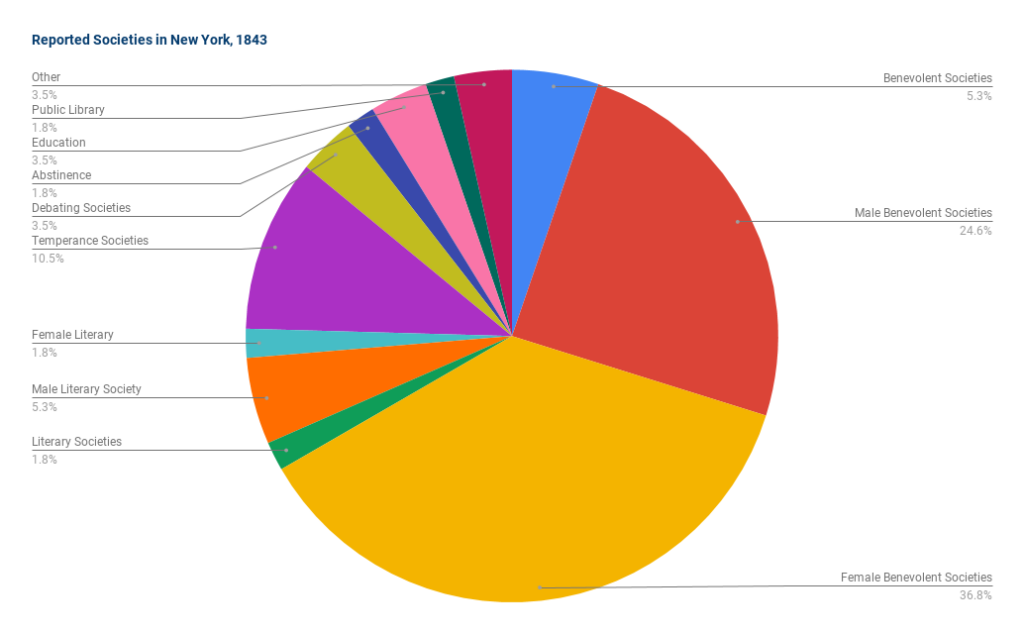
Figure 5: Societies in the Northeast and Mid-West, 1843
Figure 5. This graph compares the number and variety of reported societies in Massachusetts and Ohio. Data is drawn from the statistical report published in the 1843 convention minutes.
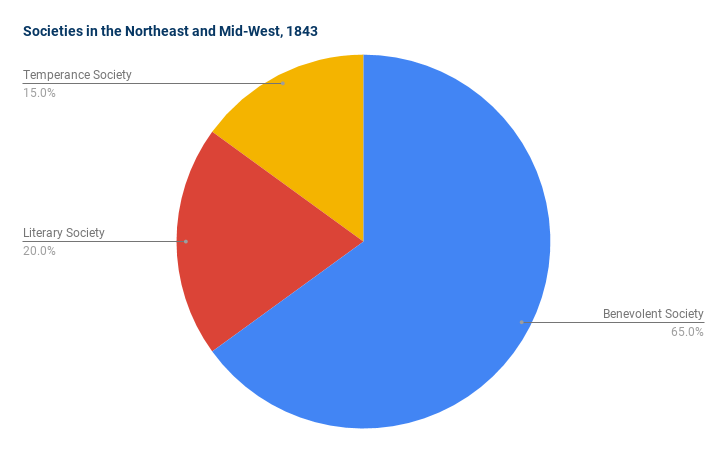
Figure 6: Report of the Committee Upon the Condition of the Colored People
This map consolidates much of the data gathered by the Report of the Committee Upon the Condition of the Colored People. Data is drawn from the statistical report published in the 1843 convention minutes. The term “colored” is taken from the statistical report.
[map embed here]
Credits
All maps and tables sourced from the Report of the Committee Upon the Condition of the Colored People presented at the 1843 National Convention of Colored Citizens at Buffalo, NY.


